BroadbandHub is posting another series of data analytics to highlight counties across the United States. We went into the E-rate data and looked at the top 60 billers in each state in order to see what the state of broadband is across the nation. By looking at counties we are able to see the average costs and the average speeds that broadband initiatives have built up over the years. Two sets of data shed light on the internet access and data connection trends across different counties, showcasing a spectrum of capacities, costs, and priorities.
Internet Access services across California counties
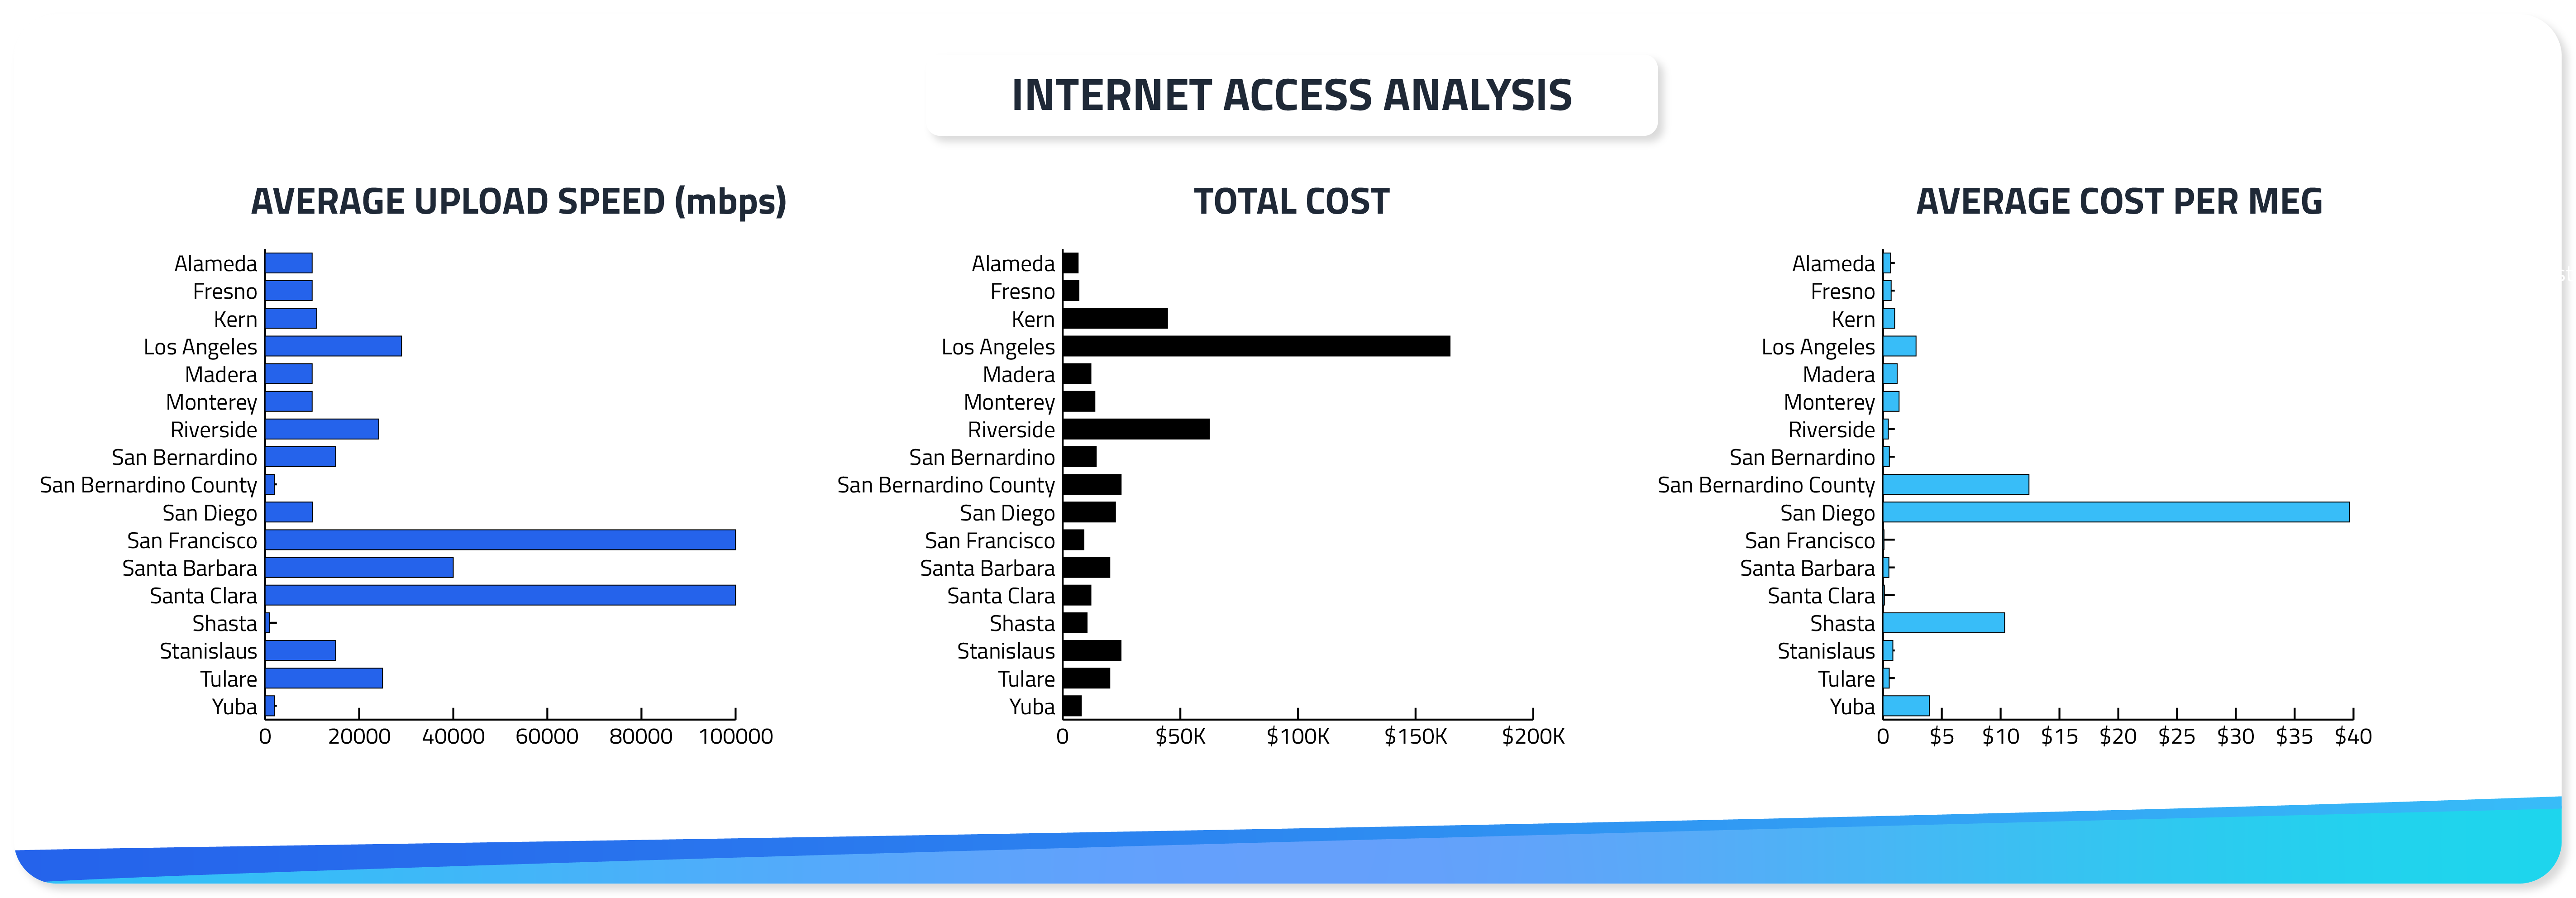
The first set of data unveils the Internet Access services in various California counties for the E-rate year 2023. Here are some notable observations:
1. Speedy connections
Counties like San Francisco, Santa Clara, and Santa Barbara boast impressive average upload speeds, each reaching 100,000 Mbps. Riverside, Tulare, and Stanislaus also exhibit substantial average upload speeds, indicating a commitment to high-speed connectivity.
2. Cost dynamics
Los Angeles takes the lead in total cost with a staggering $164,663.03, followed closely by Riverside and San Diego. Notably, San Francisco and Santa Clara manage to achieve high-speed connectivity with relatively lower total costs.
3. Cost per megabyte
San Francisco, Santa Clara, and Santa Barbara emerge as cost-efficient, with the lowest average cost per megabyte, all below $0.50. On the contrary, San Diego, San Bernardino County, and Shasta face higher costs per megabyte.
4. Overall trend
The data suggests a diverse internet access service landscape, with some counties prioritizing speed, while others focus on cost-effectiveness.
Data Connection between sites within counties
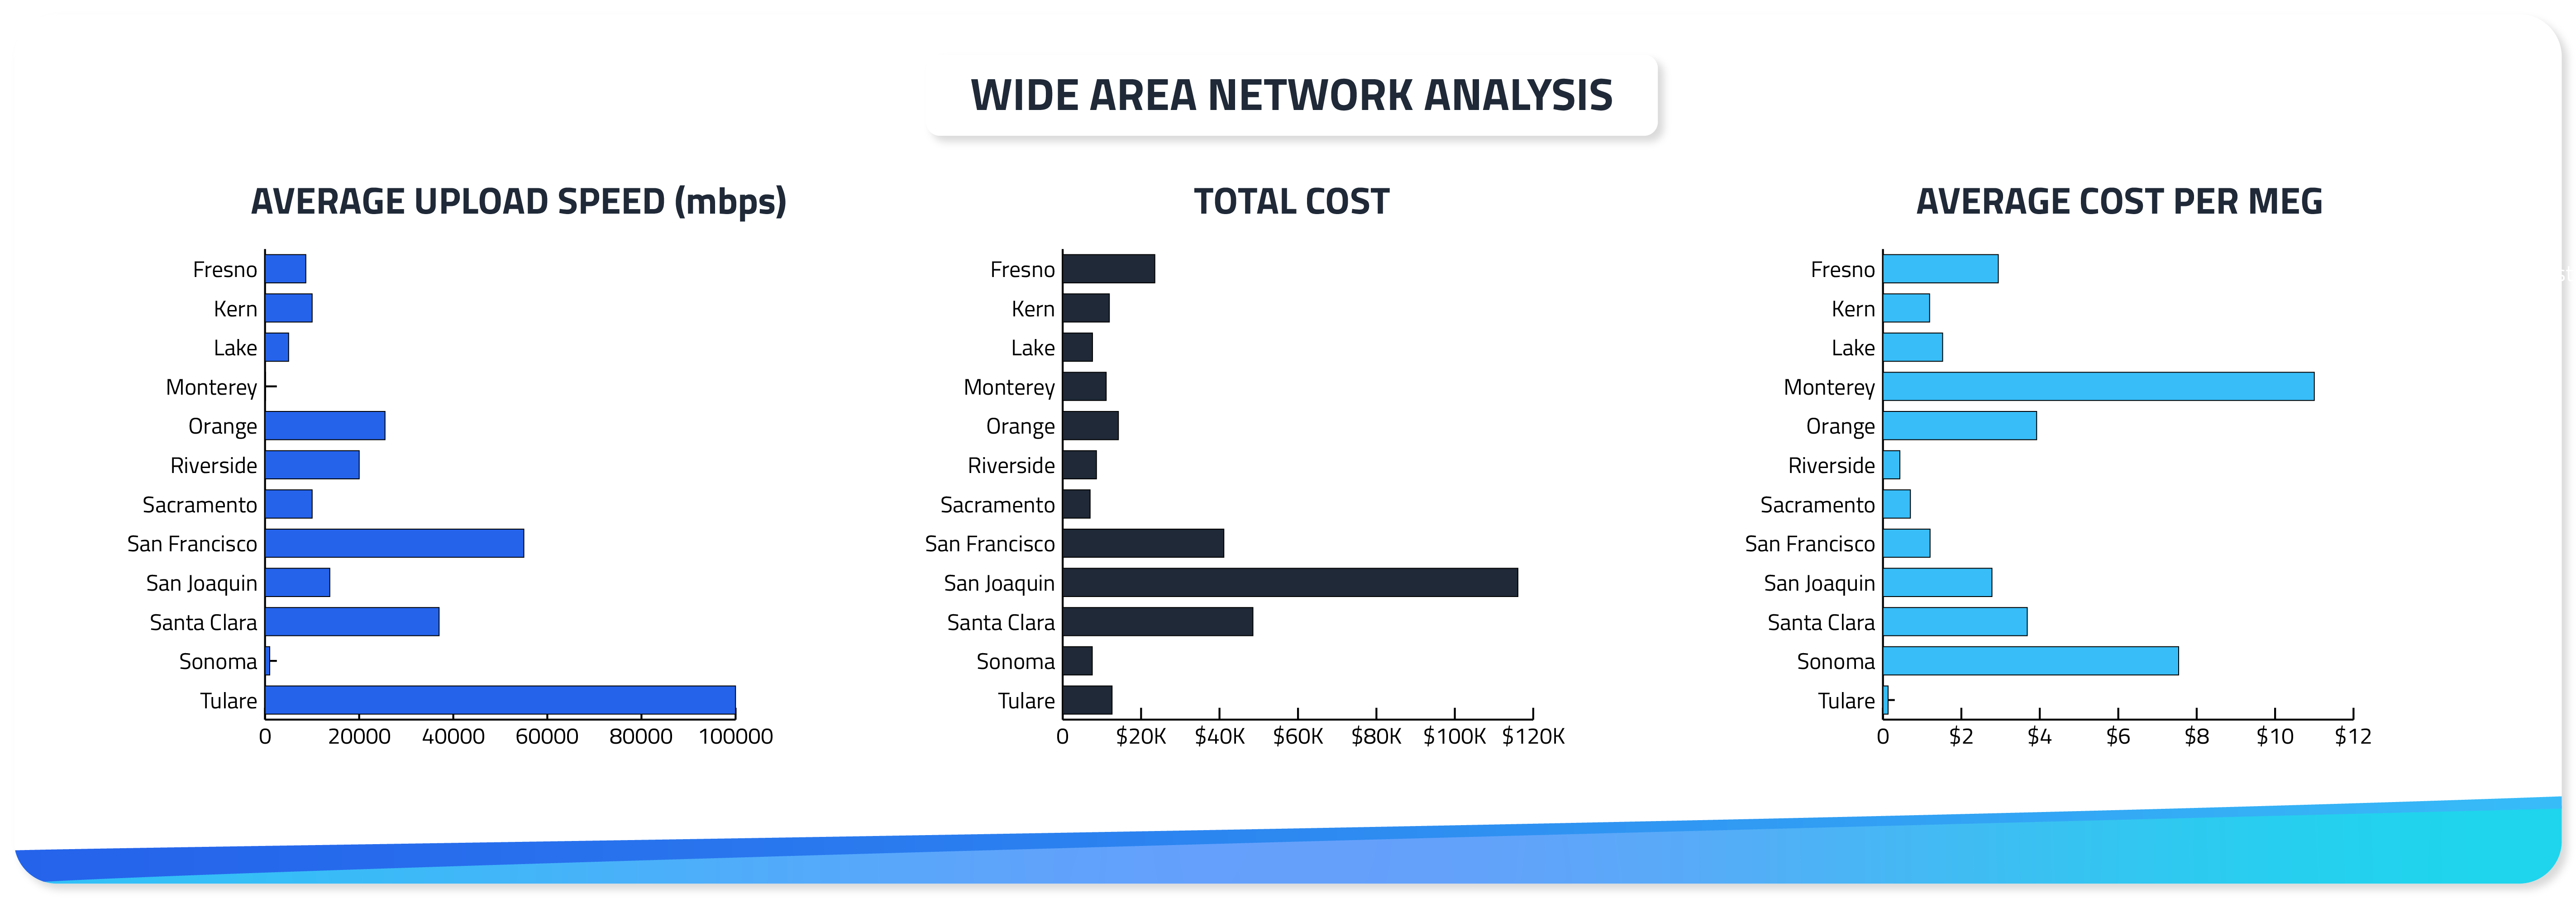
The second set of data delves into data connections between sites within counties. Let's explore the key findings:
1. High-speed data connections
Tulare, San Francisco, and Santa Clara lead in average upload speeds, showcasing robust data connections ranging from 37,000 to 100,000 Mbps.
2. Varied total costs
San Joaquin tops the list with the highest total cost at $116,100.00, followed by Santa Clara and Tulare. Counties like Sonoma, Sacramento, and Lake maintain relatively lower total costs.
3. Cost per megabyte for data connection:
Tulare, Riverside, and Sacramento stand out with the lowest average cost per megabyte, all below $1.00. Santa Clara, Orange, and San Joaquin grapple with higher costs per megabyte for data connections.
4. Overall trend
The data connection landscape reflects a mix of high-speed solutions and cost considerations, with Tulare emerging as a cost-effective standout.
Conclusion
The data highlights the intricate digital landscapes of California counties. While some prioritize high-speed internet access services, others navigate the balance between speed and cost-effectiveness in data connections. Understanding these trends can aid policymakers, service providers, and residents in shaping the future of digital connectivity in the Golden State.
As California continues to evolve digitally, these insights pave the way for informed decision-making and the creation of resilient and efficient digital infrastructures.